Webviewer for microscopy images
Displaying and segmenting microscopy data smoothly on the screen at different resolution levels pushes even modern tools to their technical limits. SCS developed a powerful web viewer for ariadne.ai.

-

Initial situation
Microscopy images quickly generate large amounts of data due to high resolutions, many image planes and detailed segmentations. It is therefore a challenge to display these smoothly in a modern web viewer.
-
SCS solution
SCS developed a modern web viewer for ariadne.ai based on Neuroglancer and Angular, which can display the images smoothly and offers the user various algorithms for processing the data. The linked metadata of individual image layers can be selected in a scatter plot, whereupon the display is customised.
-
Added value
The robust and intuitive front end displays the image data prepared with the algorithms very quickly and smoothly in the web viewer. SCS was responsible for the entire front-end development, from requirements analysis and UI/UX design to implementation and performance analysis.



Biomedical images
ariadne.ai is a Swiss company that specialises in the automated analysis of biomedical images. This often involves processing several terabytes of image data, primarily microscopy images at various levels of resolution. The images are also segmented and cells labelled, for example. This data should now be displayed smoothly on the screen.
Modern web viewer
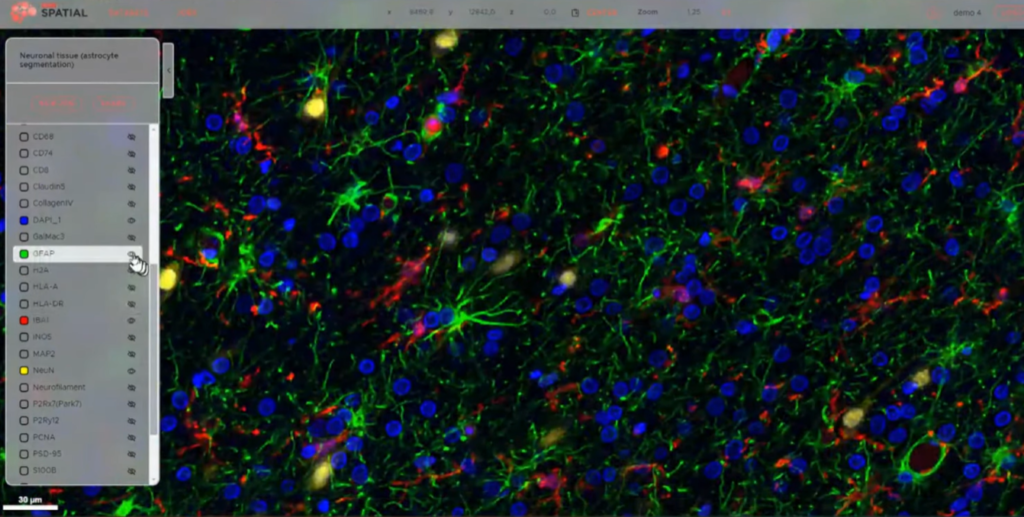
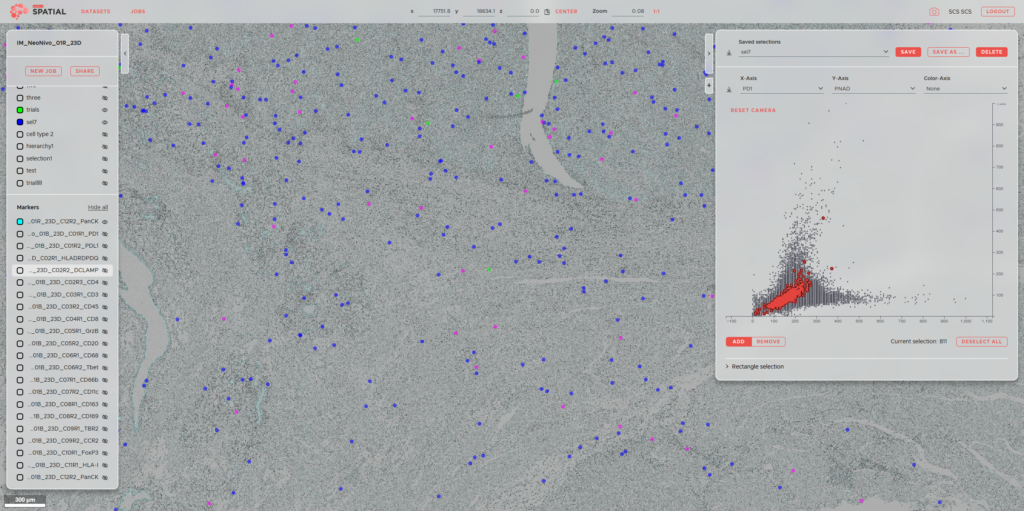
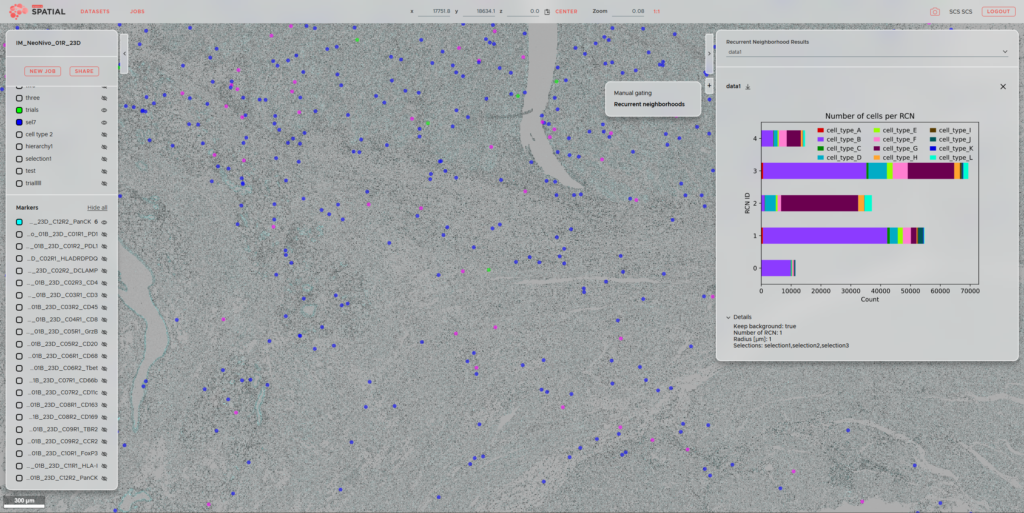
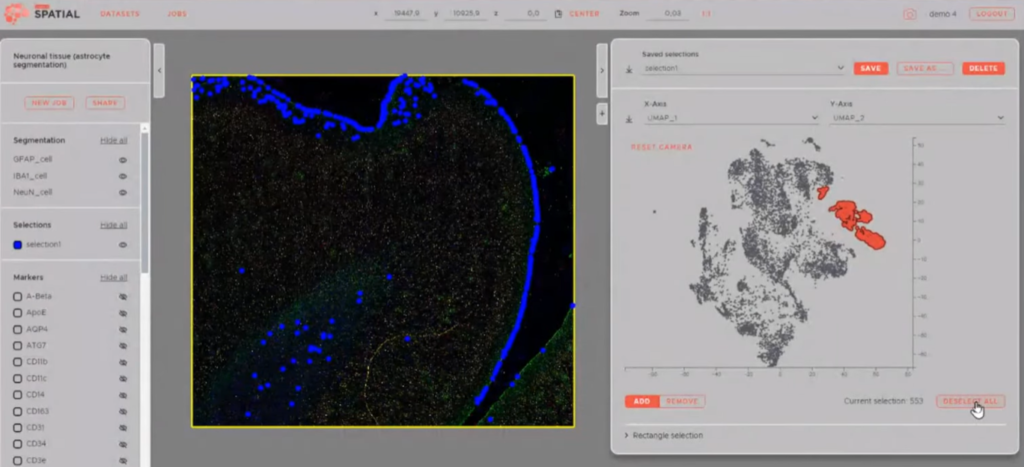
SCS developed a web viewer (Ariadne SPATIAL) for ariadne.ai, which displays the data and enables the selection of the corresponding processing algorithms and data areas. The image, segmentation and annotation data are stored in various formats and can be displayed in different resolutions – with smooth zooming and panning as well as quick selection of the relevant image layers. In addition, metadata such as statistical information from the image analysis can be displayed in a scatter plot, in which it is possible to select an area with a lasso tool. The segmentations selected in so-called selections or via “hierarchical gating”, for example the corresponding cells, are now also displayed in the microscopy image.
Frontend with Angular, Neuroglancer and D3.js
For the front end, the developers at SCS used Neuroglancer as the basis for displaying the data sets, D3.js for the interactive plots and Angular for the classic web UI components. The project included the entire front-end development from requirements analysis to wireframes, UI/UX design, dockerisation of the deployment and performance analysis and optimisation.